Finding D. Mulder, C. Kasten
Do a Google search for “Mulders Chart.” Click the images tab. You’ll quickly be inundated with hundreds of circular graphics with interconnected lines among 10 to 30 nutrients. Most of the graphics will be from online stores or gardening information websites. Some are from agricultural articles and university extension publications. Others are from alternative health sites. The applications of this graphic are quite numerous.
If you narrow your focus down to information targeting the agricultural industry, you’ll find myriad references to this classic graphic. You will likely read that it was published by D. Mulder in 1953, and that it identifies the effects of levels of one nutrient on the other nutrients, and identifies the synergisms and antagonisms among those nutrients.
Typically, in the case of such a classic piece of reference material, the original source can be easily located, and the author’s biography and body of work is easily researched. What I assumed would be a 30-minute research project turned into a bit more than anticipated.
Problem #1: Who is D. Mulder?
Armed only with a first initial, my first attempts involved the all-powerful Google. No luck there by solely searching for the name. In one of the online graphics, I saw a title: Les elements mineurs en culture fruitiere, followed by D. Mulder, Instintut de Recherches Phitopathologiques. A quick translation revealed the title: Minor Elements in Fruit Growing. Through further Googling, D. Mulder was now revealed as Derek Mulder of the Institute of Phytopathological Research in Holland.
Problem #2: Where’s the article?
The source article was material from a National Fruit Convention in Italy in 1953. I was getting closer. In a stroke of good luck, Brigham Young University had a posting of an abstract of a translated version. Apparently, the article was written in French, and translated by Dr. Bryan Hopkins and Dr. Tyler Hopkins. Unfortunately, the paper showed as withdrawn on the university website. In another even greater stroke of good luck, I was able to contact Dr. B. Hopkins, who graciously supplied his English translated version. Relatedly, Dr. Hopkins has an impressive body of work, and anyone researching soils and plants should browse his research.
Problem #3: Does the publication live up to the hype?
As you likely have already noted, the paper pertains to fruit tree production. While this in no way invalidates its importance, it does make you wonder if the oft-referenced “Mulder’s Chart” is truly applicable to the myriad applications attributed to it today: soils, plants, vitamins, body chemistry, animal welfare, etc.
In the paper, Mulder discusses 3 diagnostic methods for identifying nutrient deficiencies: injecting nutrients directly into stems, leaf analysis, and visual analysis. He firmly states that he is writing only on visual analysis, and discusses his research in Holland. Mulder gives several references to work done by T. Wallace and Emil Truog. T. Wallace’s Trace Elements in Plant Physiology was published in 1950, and is an excellent book that includes precedings on many agronomics topics. A chapter titled “Zinc Deficiency of Fruit Trees in Europe” is included, by our author of investigation, D. Mulder. Another chapter is written by one E. G. Mulder, Ph.D., also of the Netherlands. Emil Truog was a professor at University of Wisconsin. A book including some of his writings, along with fellow researchers, from 1951 was republished in celebration of the one hundredth anniversary of the U of WI: Mineral Nutrition of Plants, Emil Truog [A Symposium]. This is another fine collection of agronomic information for those interested in such research. The works also include Daniel Arnon, Ph.D. from the University of California at Berkley, in which he submits the adoption of the word “micronutrients” for English-speaking countries rather than “rare,” “trace,” or “minor” nutrients.
So, back to Derek Mulder’s chart. Printed with narrow margins, the paper fits on 9 pages. One page is dedicated to Truog’s diagram illustrating nutrient availability by pH, another classic and oft-referenced chart. Mulder’s famous antagonism wheel is buried back on page 7, and is only given a brief description.
Following the diagram, Mulder uses the final page of the article to discuss interventions when visual nutrient deficiencies are observed, such as spraying manganese and zinc sulfate solutions, borax, and sulfate of magnesia. These deficiencies were the common ones he identified for sandy soils and fluvial clay soils in Holland.
Problem #4: How do you read the chart?
Mulder specifically states how to read the diagram. A solid arrow extending from a nutrient points to the nutrient that is antagonized. Therefore, a solid arrow starting at Copper and pointing to Iron is stating that Copper can create an Iron deficiency. This specific example is described on page 6. If a dotted-line arrow is used, then the nutrient stimulates the nutrient the arrow points towards. This is commonly referred to as a synergism. I make this point because there have been many misinterpretations of the chart by simply reading it incorrectly. I’ve been told by some that an arrow going against a nutrient indicates a reverse antagonism. This is definitely NOT what D. Mulder intended.
Problem #5: Why do some versions of the charts have more nutrients than others?
Mulder states at the top of page 7 that the list of nutrients in the article “is not complete: it contains only the most remarkable actions.” One article in my Google search stated that many researchers have added to Mulder’s Chart over the years, but there were no references provided to look into the statement further. The chart in the source contains 10 elements: Mn, Ca, Cu, Mg, Zn, N, B, P, Fe, and K, starting with Mn at the 12:00 position and going clockwise around the circle.
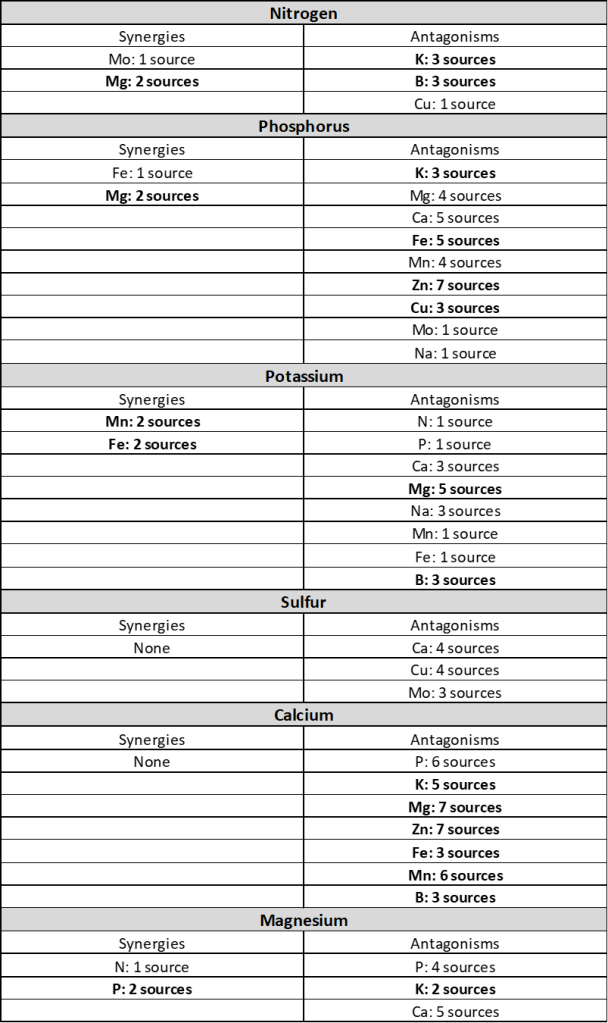
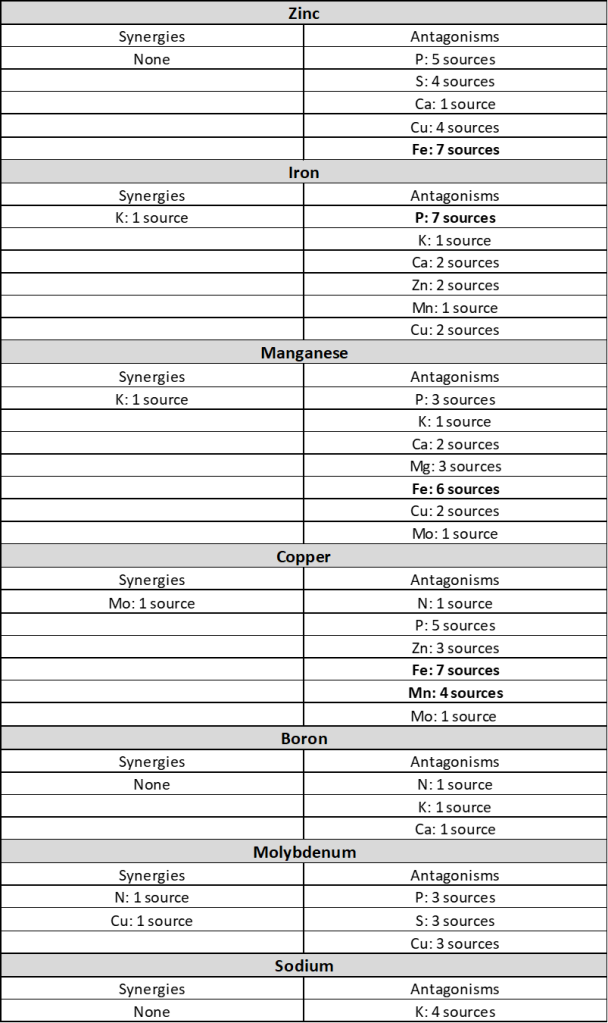
Validity of any of the other charts should be independently reviewed. In companion charts included below, I chose twenty different sources of Mulder’s Charts. After scrutinizing the connecting arrows, I reduced them down to six unique diagrams. The companion charts give a count of identified synergies and antagonisms per nutrient. I purposely have not included the diagrams I selected for the comparison. This is due to the incredible number of different charts available. My purpose was to show inconsistencies among the versions, but my primary question still remained, and is Problem #6.
Problem #6: Is Mulder’s Chart valid and/or useful?
Mulder attempted to illustrate whether a level of one nutrient has a positive or negative impact on other nutrients. Unfortunately, he does not define what levels create an antagonism or a synergism. While I agree that calcium CAN antagonize potassium, as Mulder’s Chart shows, an important piece of information is missing. WHEN is calcium likely to antagonize potassium? Under what conditions or at what levels? What if calcium is low rather than high? Excesses of a nutrient can create a deficiency symptom in another, but Mulder’s Chart does not adequately express the conditions in which such a relationship can be expected. Due to the ambiguous nature of the chart, it has been misused, misread, and misinterpreted. Mulder’s Chart cannot adequately help agronomists make nutritional recommendations, nor should it be a guide for making nutritional decisions about human health. Additionally, since there are no solid references for the multitude of versions easily located on myriad websites, the majority of them are even more useless than the original.
As a research note, I have spent just over 10 years compiling peer-reviewed research pertaining to or including information on antagonisms, levels, and nutrient ratios. Even after compiling information from well over 200 sources, I still encounter research findings that are in disagreement with “general” antagonisms. Only after multiple, unique sources and experiments agree do I include it in my agronomical work. This is not as “neat” as Mulder’s Chart, but the practical application of nutrient antagonisms can be realized and has been beneficial in identifying and minimizing limiting factors in crop production.
How is Mulder’s Chart useful?
What Mulder’s Chart DOES do is remind us that everything is connected. It is a reminder that as we adjust one part of a system, there will likely be impacts on other parts of the system. To dive deeper into the interconnectedness of soil and plant nutrients, plant physiological studies and soil science investigations should be researched. There is a large body of work from the late-1800s to now regarding these concepts. Excellent work on soil thermodynamics, soil solutions, soil amendments, and plant physiology has been conducted for decades and continues to this very day.
The other useful part that Mulder’s Chart plays is a reminder to question everything you see. Verify the information you are receiving. Mulder’s Chart is a classical reference that is accepted as “settled science.” The facts that the author is so obscure, and the original paper was difficult to locate, were both surprising to me. It serves as an excellent reminder to go back to the source of information, verify it, and make a decision of its value based on your investigation.
Chris Kasten
Companion Charts:
The charts on the following two pages compare the number of antagonisms identified by each nutrient from unique versions of Mulder’s Chart. Mulder’s original chart was used as a seventh reference. Synergies and antagonisms included in Mulder’s original article are in boldface font.